
Toronto’s real estate market is starting to feel unfamiliar. After a long stretch of rapid price growth and relentless competition, the landscape is shifting. Buyers, once forced into rushed decisions, are now taking their time. Sellers, who could once count on quick sales and soaring offers, are facing a market where patience and pricing strategy matter more than ever.
With sales down, inventory rising, and interest rates keeping affordability in check, economic uncertainty is adding another layer of complexity. The recent U.S. tariffs on Canadian imports are fueling concerns about job security and consumer confidence, potentially dampening demand further. As trade tensions and their broader economic impact unfold, the question isn’t just whether the market is cooling—it’s whether this shift is here to stay.
Sales Plummet, but Price Declines Remain Gradual—For Now
2025 has experienced the slowest start to the year for sales in recent memory. Traditionally, the first few months of the year are a busy time for the real estate market, but this year’s market has been uncharacteristically sluggish. The chart below (courtesy thehabistat.com), illustrates this.
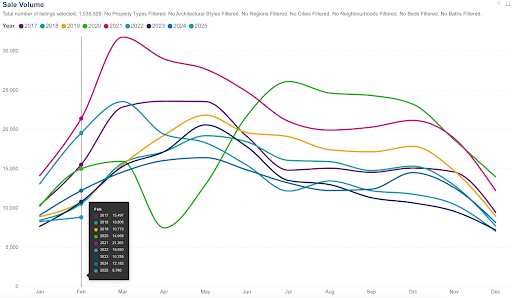
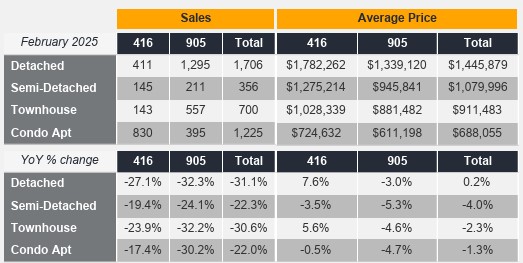
TRREB data for February also reveals a widespread drop in sales across all major housing types, with every segment experiencing double-digit declines compared to last year. However, while prices have softened across most categories, declines have remained moderate, and some segments have held steadier than others despite slowing transactions:
- Detached homes: Sales fell 31.1 per cent, with 1,706 transactions. Prices, however, held steady, rising 0.2 per cent to $1,445,879.
- Semi-detached homes: Sales declined 22.3 per cent, with 356 sales recorded. Prices decreased 4.0 per cent, settling at $1,079,996.
- Townhouses: Sales dropped 30.6 per cent to 700 transactions, while prices softened by 2.3 per cent to $911,483.
- Condo apartments: Experienced a 22.0 per cent decline in sales (1,225 transactions), while the average price dipped 1.3 per cent to $688,055.
A detailed region-wise breakdown of sales and average price for the GTA is provided in the table below (courtesy TRREB). ‘416’ refers to the City of Toronto, while ‘905’ represents the surrounding GTA regions.
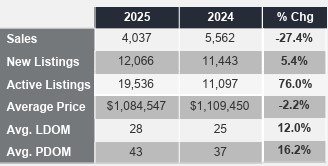
One key reason prices have seen only modest declines despite declining sales may be seller resistance. Many homeowners remain reluctant to lower their asking prices, particularly after years of sustained price growth. At the same time, market conditions are increasingly favoring buyers, with homes taking longer to sell. This shift is reflected in the rise in average listing days on market (LDOM) to 28 days (up 12.0% year-over-year) and average property days on market (PDOM) to 43 days (up 16.2% year-over-year).The rise in available inventory also remains a recurring trend in February, continuing the pattern observed in January. Active listings have surged by 76 per cent year-over-year, while new listings have increased by 5.4 per cent, expanding buyer options significantly.
The year-over-year variation in important metrics is given in the following table (courtesy TRREB).
A Market Favoring Buyers—But Many Are Still Holding Back
For those looking to buy, conditions haven’t been this favorable in years. With inventory rising and demand slowing, buyers now have more choices, more negotiating power, and less urgency to act quickly. The once cutthroat market has shifted, giving buyers more control:
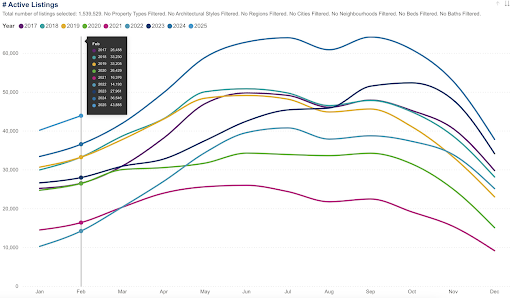
- Significant increase in active listings: Active listings have reached levels unseen in recent memory. See the chart below (courtesy theHabistat.com).
- Fewer bidding wars: Competition has eased, allowing buyers to make more calculated decisions.
- More negotiating power: Sellers, facing longer listing times, may be more open to price adjustments and conditions.
- Better timing for decision-making: With homes sitting on the market longer, buyers have more time to evaluate options.
Despite these advantages, many buyers remain hesitant, held back by high mortgage rates and broader economic uncertainty.
High Mortgage Rates Are Still a Barrier
While buyers can now negotiate more aggressively, borrowing remains expensive, limiting affordability. TRREB President Elechia Barry-Sproule noted that many households are eager to buy but struggling to afford monthly payments at these rates. Lower borrowing costs—if and when they arrive—could be the key to reviving demand.
Economic Uncertainty Is Holding Back Confidence
Beyond mortgage rates, some buyers are waiting for greater economic stability before making a move.
- High Unemployment in Toronto: The city’s 8.4% unemployment rate is raising concerns about job security and home affordability.
- Impact of U.S. Tariffs on Canada: The recent implementation of U.S. tariffs on Canadian imports is expected to intensify economic instability.
TRREB Chief Market Analyst Jason Mercer suggests that if economic uncertainty clears up in the coming months, buyer confidence could return, leading to stronger market activity later in the year. Until then, the market remains in a delicate balance, offering opportunities for those who can navigate the challenges.
What’s Next? Will the Market Pick Up or Cool Further?
The big unknown is whether sales will rebound later in 2025 or continue to slow. Several factors will influence the market’s direction in the coming months:
What Could Keep the Market Sluggish?
- Rates stay high for longer: If interest rates don’t come down, affordability issues will persist.
- Sellers refuse to adjust pricing: If homeowners continue holding out for higher prices, fewer transactions will occur.
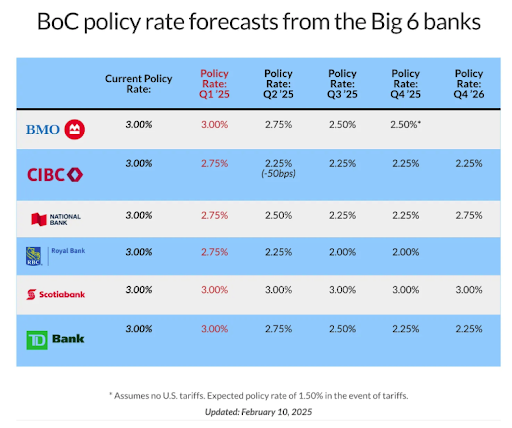
Ongoing Economic Uncertainty: The recent implementation of U.S. tariffs on Canadian imports is anticipated to increase economic instability, primarily by creating trade uncertainty and negatively affecting market sentiment. Concerns about potential job disruptions and rising costs in critical sectors may cause consumers to postpone their purchasing decisions, further slowing real estate activity and dampening both sales and price growth. Additionally, the tariffs may prompt the Bank of Canada to lower interest rates more aggressively than previously expected to stimulate the economy and offset adverse impacts. See the table below for Bank of Canada policy rate forecasts from prominent banks. However, despite the resulting improvement in borrowing conditions, fears regarding employment may still deter prospective homebuyers, prolonging uncertainty in the housing market.
With the spring market approaching, these factors will be closely watched to see whether Toronto’s real estate market remains soft or begins to rebound.
What This Means for Buyers, Sellers, and Investors
For Buyers
If you have the financial flexibility to buy now, this could be one of the best opportunities in recent years to secure a home without intense competition. With more homes available, negotiation is back on the table. However, economic uncertainty, including the impact of U.S. tariffs on Canadian industries, could affect job stability, so buyers should factor in broader economic conditions alongside mortgage rates.
For Sellers
This is no longer a market where overpriced listings sell in days. If you’re serious about selling, it’s important to price competitively and be prepared for longer listing times. Homes are still selling, but only when realistic expectations are set. Trade tensions and economic uncertainty could further weaken demand, meaning sellers should be prepared for a slower market and more cautious buyers.
For Investors
Although the GTA rental market has shown signs of softening, real estate still holds potential as a long-term investment. However, U.S. tariffs and broader trade uncertainty may impact economic growth, employment, and consumer spending, potentially affecting rental demand and price growth. With borrowing costs still high, cash flow analysis is more critical than ever. Investors who can minimize reliance on financing may find strategic opportunities, particularly as market conditions shift in favor of well-capitalized buyers. Should this downturn result in economic uncertainty and falling prices, there may be bargains to be found for well-capitalized investors with dry powder heading into 2025 and 2026.
Conclusion
Toronto’s real estate market is in transition. Sales have slowed, inventory is rising, and homes are sitting longer.
Whether this slowdown is temporary or the start of a prolonged cooling period remains to be seen. Much will depend on how economic conditions, interest rates, and trade tensions shape buyer confidence in the months ahead.
For now, buyers have a rare window of opportunity—with less competition and more negotiating powe —but whether they act remains uncertain amid shifting conditions.