
Table of Contents
The Canada housing market is undergoing a shift that is easy to miss in the headlines yet significant in its implications. Data from July points to a re-calibration in the balance between buyers and sellers.
National home sales rose 3.8 per cent from June, the fourth consecutive monthly gain, and are up 11.2 per cent since March. The Greater Toronto Area has led the rebound with transactions climbing 35.5 per cent over that period. At first glance, it may appear the market is staging a traditional recovery. In reality, the momentum is not being driven by optimism or cheaper borrowing. The real catalyst is falling prices.
Closing the gap
BMO Capital Markets has long pointed to the main challenge, which is the gap between what sellers expect and what buyers are willing to pay. Robert Kavcic, senior economist, describes it as a “wide bid-ask spread” that has slowed transactions and left listings sitting on the market.
It outlines three ways this gap could close. The first is forced selling brought on by a recession, rising defaults and job losses. This is neither imminent nor desirable. The second is a sharp drop in mortgage rates into the low three per cent range, which would require a cut of roughly 100 basis points from current levels and is considered unlikely in the short term. The third is lower prices.
It considers price reductions the most realistic outcome. RBC reaches a similar conclusion, noting that softer prices in several regions have delivered the biggest affordability improvement in three years and have encouraged more buyers to act.
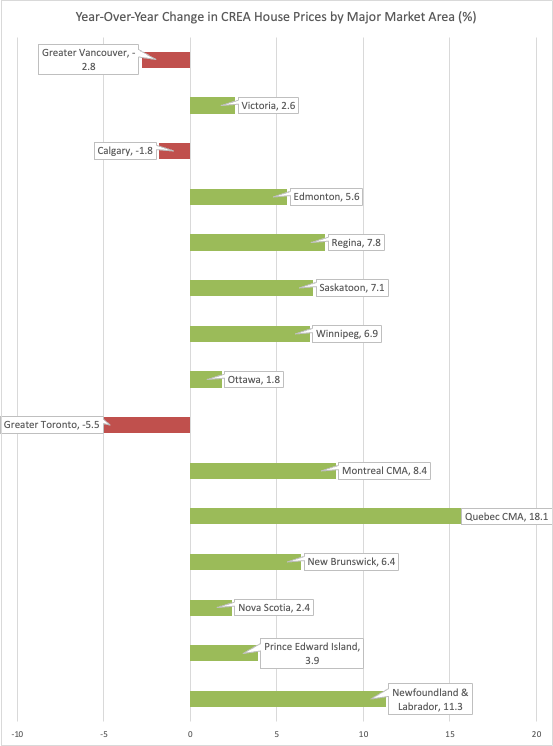
The CREA numbers reflect this shift. July’s MLS® Home Price Index was unchanged from June but 3.4 per cent lower than a year earlier. In the GTA, values are down 5.5 per cent year-over-year. Vancouver has fallen 2.8 per cent. Calgary, which had previously resisted the trend, is now 1.8 per cent lower. These declines have been enough to bring more buyers back into the market.
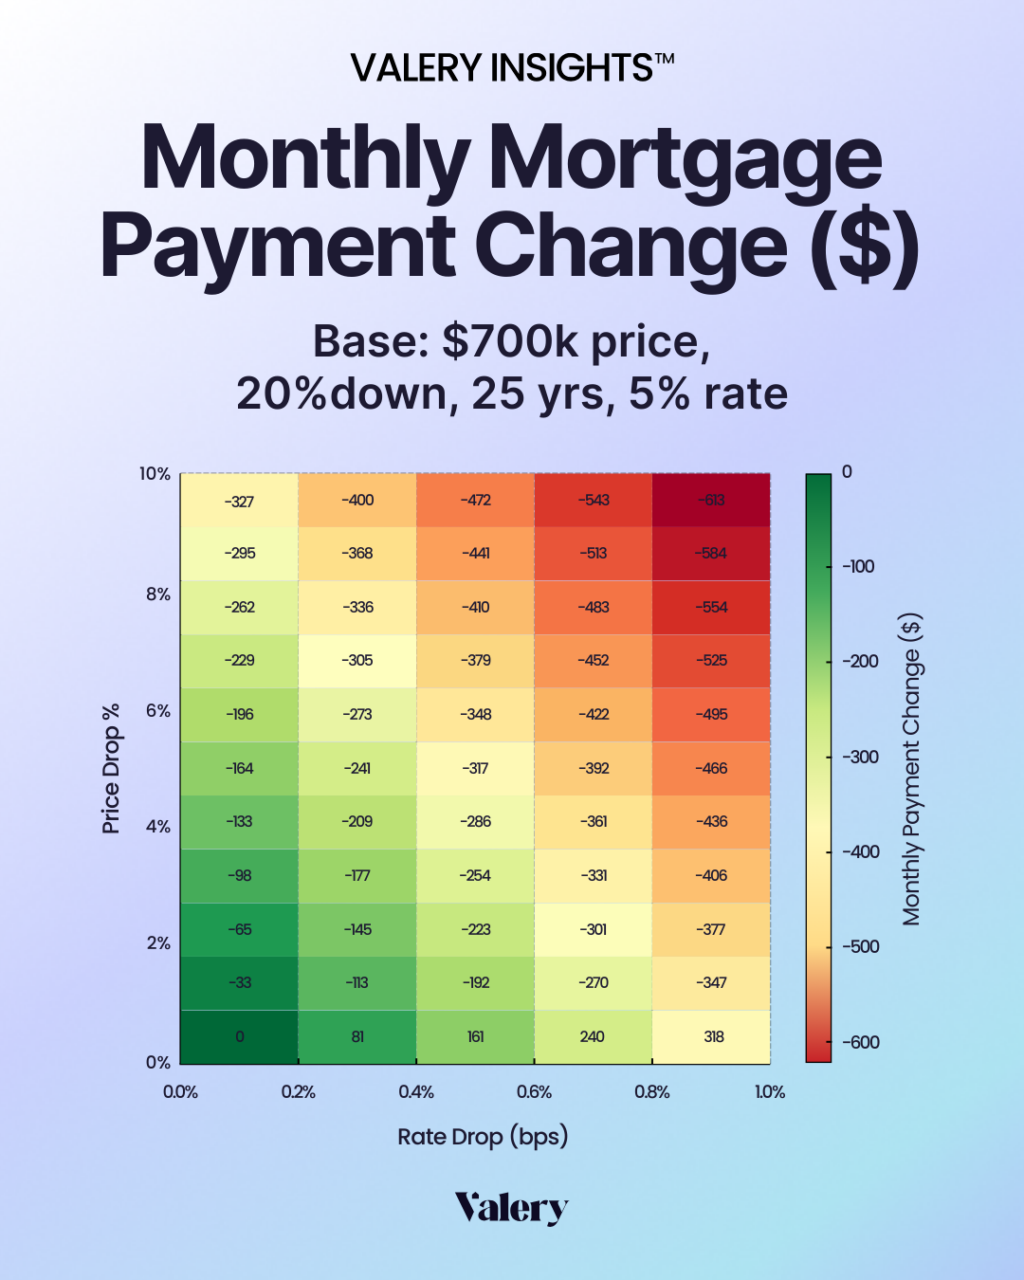
Price shifts have a greater impact on affordability than rate cuts
In today’s interest rate environment, falling prices improve affordability more than small cuts to borrowing costs. On a $700,000 home with 20 per cent down, a 25-year amortization and a five per cent mortgage rate, a five per cent price drop lowers the monthly payment by about $165. A 25-basis-point rate cut lowers the payment by only about $58.
The message is clear. In the near term, price moderation will have more influence on demand than marginal changes to the Bank of Canada’s policy rate.
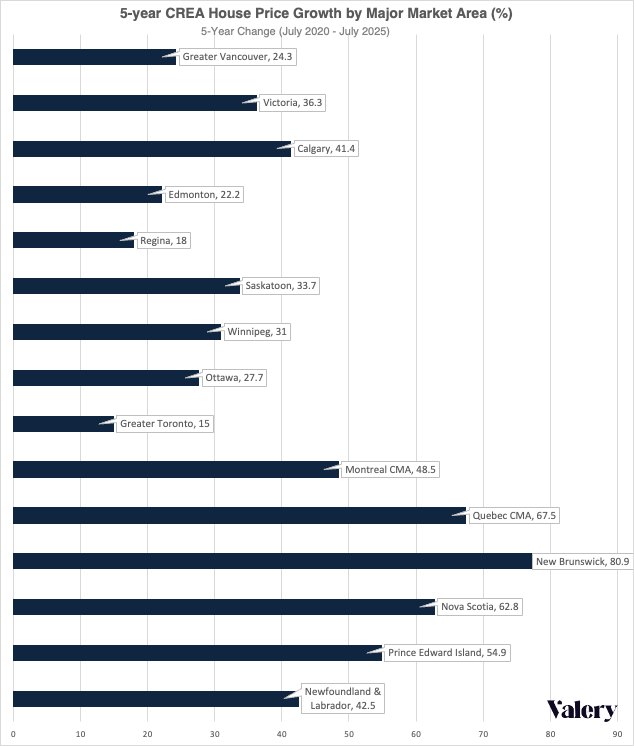
Five-year growth patterns reveal sharp contrasts
Price trends over the past five years vary widely by city. Toronto, Vancouver and now Calgary have all recorded year-over-year declines. Over the five-year period, Toronto’s prices are up just over 15 per cent, the weakest performance among major Canadian markets. New Brunswick leads with an 80.9 per cent increase. Over the past three years, Toronto has seen the steepest drop, while Quebec City has posted the strongest gains.
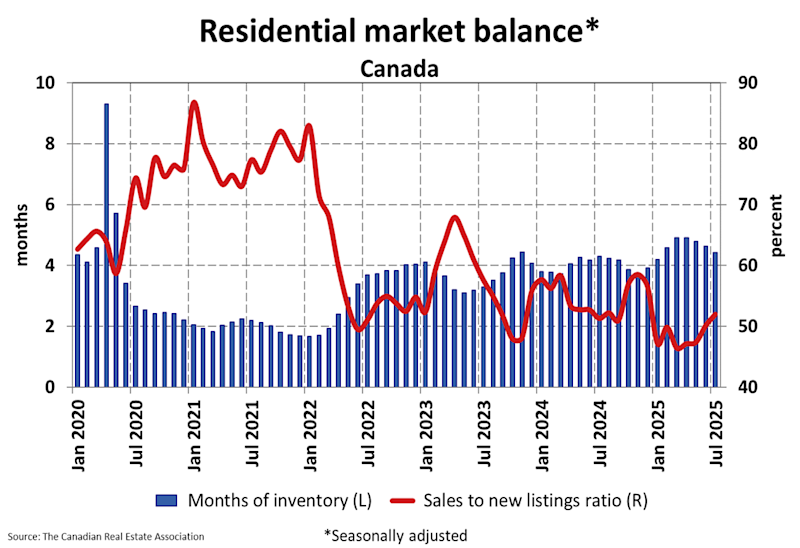
A split-screen view of inventory
July’s new listings were nearly unchanged from June, but active listings were 10.1 per cent higher than a year ago. National inventory sat at 4.4 months, which is generally consistent with balanced conditions. The picture changes dramatically by region.
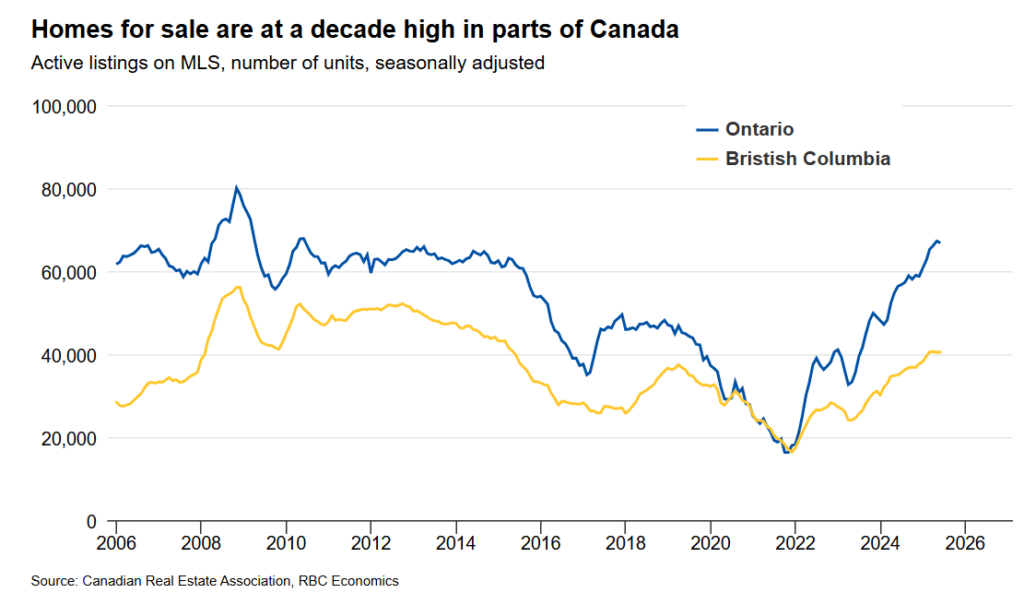
RBC Economics in the same report referenced above, shows that Ontario and British Columbia have the highest inventory levels in a decade, creating strong competition among sellers and likely keeping prices under pressure well into 2026. In the Prairies, Quebec and Atlantic Canada, supply remains tight and in some areas is below pre-pandemic norms. This explains why price corrections are unlocking demand in some provinces while others remain firm.
September will be the real test
The fall market will reveal how durable the recent gains are. CREA describes September’s influx of new listings as a potential turning point that could either sustain the momentum or push sellers toward deeper price reductions.
The recent rise in sales is grounded in opportunity rather than exuberance. With borrowing costs still elevated, price adjustments have been and will continue to be the most effective tool for attracting buyers. In many major markets, values have eased just enough to restore a measure of affordability, reinforcing the view that the Canada housing market will find its next phase of recovery through continued price normalization rather than aggressive rate cuts.
Valery AI is trained on the latest market reports and insights to show you exactly how today’s shifts affect your numbers, risks, and opportunities. Get your Personalized Real Estate Playbook now.