
Table of Contents
If there’s one thing the March 2025 data tells us about the Greater Toronto Area (GTA) housing market, it’s this: the sky isn’t falling, it’s just clearing up a little. For years, we’ve seen an overheated housing market marked by soaring prices, fierce bidding wars, and buyer anxiety that left many people wondering if they’d ever be able to afford a home.
Now, things are slowing down. But rather than signaling a crash, this cooling trend looks more like a needed reset. The frenzy is fading, and the market is finally acting like a market again.
The Housing Market Isn’t Crashing, It’s Catching Its Breath
Let’s start with the numbers: sales were down 23.1% in March compared to the same month last year, according to the Toronto Regional Real Estate Board (TRREB). That kind of drop might sound alarming, but the reality is a lot less dramatic. This isn’t a disappearance of demand – it’s a pause. Buyers are still out there. They’re just being cautious.
That caution is largely due to two factors: mortgage rates and political uncertainty. Mortgage rates remain elevated compared to the ultra-low levels of the early 2020s, and with a federal election on the horizon, many buyers are waiting to see how the political winds will blow.
A Welcome Shift in Affordability
For the first time in years, affordability is actually improving. In March, the average sale price across the GTA came in at $1,093,254 – a 2.5% drop compared to March 2024. Meanwhile, the MLS® Home Price Index (HPI) Composite Benchmark, which smooths out market noise, was down 3.8% year-over-year.
This isn’t just happening in one or two neighborhoods. It’s a broader trend, signaling that price softening is becoming more systemic.
TRREB President Elechia Barry-Sproule summed it up well: buyers are starting to regain something they haven’t had in a long time—negotiating power. And that’s a major shift. With more inventory and less pressure to act fast, buyers can take their time, ask questions, and push back on pricing.
Emotional Gridlock: Why Buyers Are Holding Back
March felt quieter than usual, not because there’s no interest in real estate, but because there’s uncertainty hanging in the air. According to TRREB’s Chief Market Analyst Jason Mercer, a mix of trade unpredictability and the upcoming election is making households more cautious.
People aren’t just thinking about home prices – they’re thinking about job stability, interest rates, and whether new government policies might change the financial landscape. That creates what feels like a psychological stalemate: buyers want to act but are waiting for more clarity, and sellers are figuring out how to respond to that new dynamic.
More Listings, More Balance
On the bright side, Inventory is up and that’s a good thing.
In March, new listings surged 28.6% year-over-year to 17,263, while active listings climbed to 13,633 (a 9.5% increase). This injection of supply is helping the Housing market rebalance. Instead of homes flying off the shelf in two days with twenty offers, we’re seeing more thoughtful, paced transactions.
The sales-to-new-listings ratio dropped to 36.6%, pushing us firmly into buyer’s market territory. That means there’s less urgency and more choice, allowing buyers to evaluate their options and negotiate from a stronger position.
Homes are also taking longer to sell. The average time on market increased from 20 to 24 days. That doesn’t mean homes aren’t selling – it just means strategy and pricing matter more now than ever.
This shift is a good thing because a functioning market isn’t one defined by speed and scarcity, but by balance—where buyers have options, sellers must justify price, and negotiation returns to the table.
Sellers who priced homes as if it were still 2021 were often met with silence. But those who understood the moment—and listed accordingly—still closed deals. In today’s housing market, preparation, presentation, and patience aren’t just helpful; they’re essential.

Which Property Types Are Feeling the Shift?
All housing types have been impacted by this slowdown—but in slightly different ways.
The price movements, though broadly downward, reveal subtle shifts in how different buyer groups responded to market conditions. Detached homes remained the most expensive, averaging $1.44 million in March. Semi-detached homes came in at $1.11 million, townhomes at $908,000, and condos at a more accessible $682,000.
But what’s really telling is the sales activity, not just the pricing. Detached homes saw the steepest year-over-year drop in sales—down 24.9%. Condos weren’t far behind, falling 23.5%, with similar declines in semis and townhomes.
This suggests the hesitation is widespread. It’s not just first-time buyers or investors—it’s everyone. In particular, the slowdown in detached home activity may point to a pause among “move-up” buyers—those who already own but were thinking of upgrading. Many of them are sitting on significant equity but are waiting for interest rates or political uncertainty to resolve before making a big financial leap.
Meanwhile, the drop in condo activity highlights ongoing challenges for first-time buyers, many of whom are still stretched thin by financing costs.

Keep an Eye on the Bank of Canada and Parliament Hill
If there’s one factor that could shake the housing market out of its current lull, it’s interest rates.
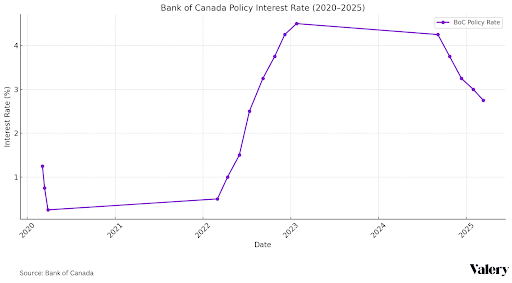
In March, the Bank of Canada cut its key overnight rate to 2.75%. That’s a step toward more accessible borrowing, even if we’re not returning to the rock-bottom rates of the early 2020s. The move is intended to stimulate the economy amid trade turbulence, and if further cuts follow, that could stir more activity in the housing market.
On the political front, the upcoming federal election is adding another layer of suspense. Housing is once again a top priority for voters, and every party is feeling the pressure to deliver on affordability, supply, and taxation reforms. While we don’t yet know the specifics, one thing is clear: housing policy will be front and center this election season.
This is the Market We Were Waiting For
This slower, more deliberate market may feel unfamiliar after years of chaos—but it might actually be the healthiest version we’ve seen in a while.
The signs were there back in February: softer sales, easing prices, and rising inventory. March simply confirmed what many in the industry suspected—this isn’t a crash. It’s a correction.
Buyers are cautious but curious. Sellers are learning how to adapt. And real estate professionals are adjusting to a new normal where fundamentals matter more than fear or frenzy.
This isn’t the GTA housing market of the last five years. But it might be the one we’ve needed all along—one where balance, sustainability, and strategy can finally take center stage.